From Claude with some prompting
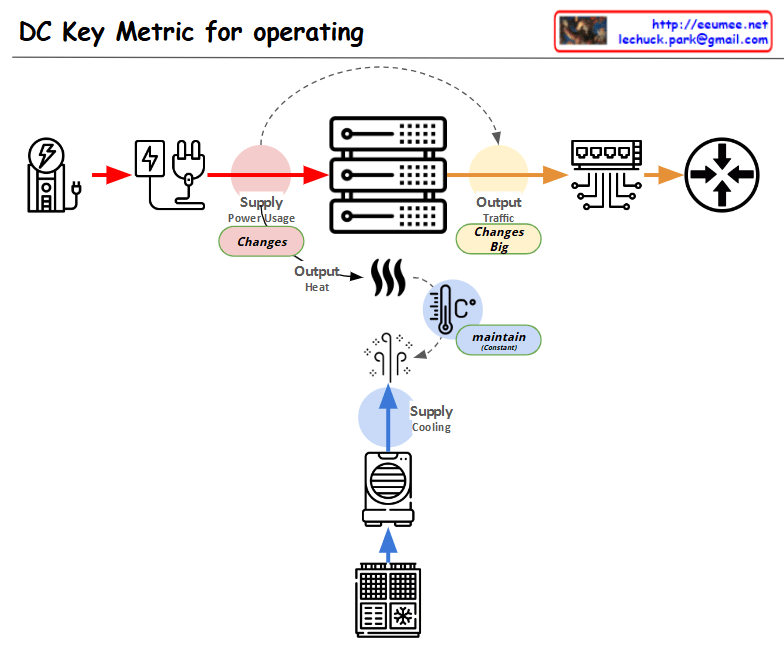
This diagram showing the key metrics for Data Center (DC) operations:
- Power Supply Chain:
- Power input → Power conversion/distribution → Server equipment
- Marked as “Supply Power Usage” with a note indicating “Changes” in variability
- Server Operations:
- Server racks shown in the center
- Two main outputs:
- Top: “Output Traffic” with a note “Changes Big” indicating high variability
- Bottom: “Output Heat” generation
- Cooling System:
- Cooling equipment shown at the bottom
- Marked as “Supply Cooling”
- Temperature icon with “maintain” indicator showing the need to maintain consistent temperature
- Overall Flow:
- Power input → Server operations → Network output
- Separate cooling circulation system for heat management
The diagram illustrates the interconnection between three critical elements of data center operations:
- Power supply management
- Server operations
- Cooling system
Each component shows potential variability points (marked as “Changes”) and management requirements, with special attention to:
- Power usage monitoring
- Traffic output management
- Heat dissipation and temperature control
This visualization effectively demonstrates how these systems work together in a data center environment, highlighting the key areas that require monitoring and management for optimal operation.
