‘IF THEN’ with AI

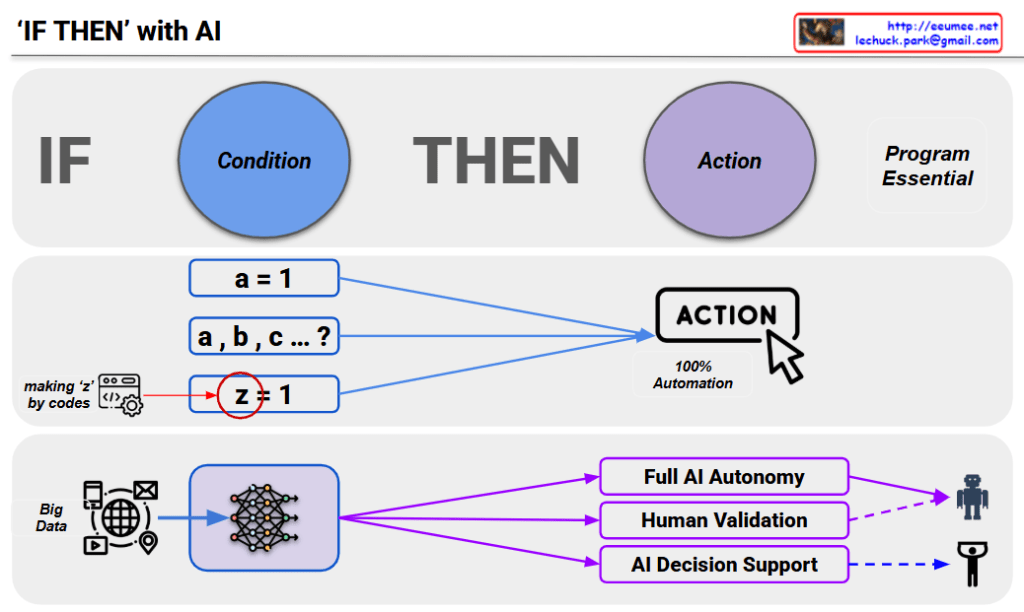
This image is a diagram titled “IF-THEN with AI” that explains conditional logic and automation levels in AI systems.

Top Section: Basic IF-THEN Structure

  • IF (Condition): Conditional part shown in blue circle
  • THEN (Action): Execution part shown in purple circle
  • Marked as “Program Essential,” emphasizing it as a core programming element

Middle Section: Evolution of Conditional Complexity

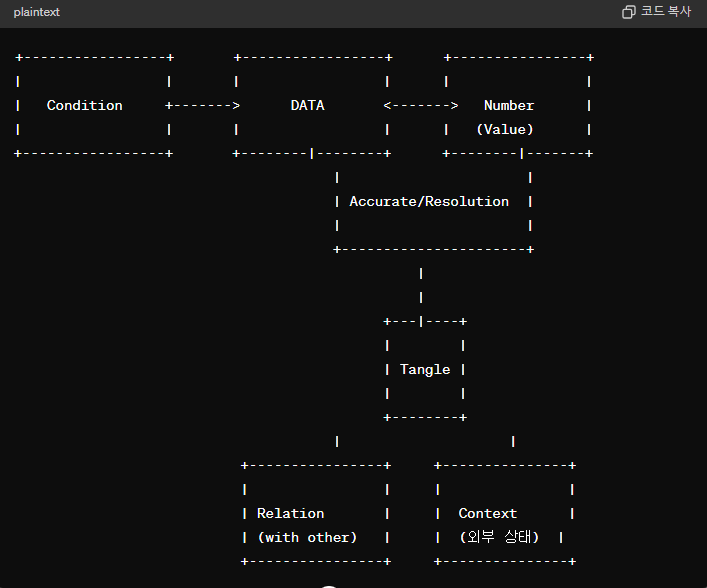
AI is ultimately a program, and like humans who wanted to predict by sensing data, making judgments, and taking actions based on those criteria. IF-THEN is essentially prediction – the foundation of programming that involves recognizing situations, making judgments, and taking actions.

Evolution stages of data/formulas:

  • a = 1: Simple value
  • a, b, c … ?: Processing multiple complex values simultaneously
  • Z ≠ 1: A condition that finds the z value through code on the left and compares it to 1 (highlighted with red circle, with annotation “making ‘z’ by codes”)

Now we input massive amounts of data and analyze with AI, though it has somewhat probabilistic characteristics.

Bottom Section: Evolution of AI Decision-Making Levels

Starting from Big Data through AI networks, three development directions:

  1. Full AI Autonomy: Complete automation that evolved to “Fine, just let AI handle it”
  2. Human Validation: Stage where humans evaluate AI judgments and incorporate them into operations
  3. AI Decision Support: Approach where humans initially handle the THEN action

Key Perspective: While these three development directions exist, there’s a need for judgment regarding decisions based on the quality of data used in analysis/judgment. This diagram shows that it’s not just about automation levels, but that data quality-based reliability assessment is a crucial consideration.

Summary

This diagram illustrates the evolution from simple conditional programming to complex AI systems, emphasizing that AI fundamentally operates on IF-THEN logic for prediction and decision-making. The key insight is that regardless of automation level, the quality of input data remains critical for reliable AI decision-making processes.

With Claude

Sequential vs Parallel

This image illustrates a crucial difference in predictability between single-factor and multi-factor systems.

In the Sequential (Serial) model:

  • Each step (A→B→C→D) proceeds independently without external influences.
  • All causal relationships are clearly defined by “100% accurate rules.”
  • Ideally, with no other associations, each step can perfectly predict the next.
  • The result is deterministic (100%) with no uncertainty.
  • However, such single-factor models only truly exist in human-made abstractions or simple numerical calculations.

In contrast, the Parallel model shows:

  • Multiple factors (a, b, c, d) exist simultaneously and influence each other in complex ways.
  • The system may not include all possible factors.
  • “Not all conditions apply” – certain influences may not manifest in particular situations.
  • “Difficult to make all influences into one rule” – complex interactions cannot be simplified into a single rule.
  • Thus, the result becomes probabilistic, making precise predictions impossible.
  • All phenomena in the real world closely resemble this parallel model.

In our actual world, purely single-factor systems rarely exist. Even seemingly simple phenomena consist of interactions between various elements. Weather, economics, ecosystems, human health, social phenomena – all real systems comprise numerous variables and their complex interrelationships. This is why real-world phenomena exhibit probabilistic characteristics, which is not merely due to our lack of knowledge but an inherent property of complex systems.

With Claude

Data

From Claude with some prompting
This image presents a comprehensive definition of data that goes beyond just numerical values. To clearly understand data, several elements must be considered.

First, the accuracy and resolution of the data itself are crucial. The “Number (Value)” represents numerical values that must be precise and have an appropriate level of resolution.

Second, data is closely related to external factors. “Condition” indicates a relationship with the state or condition of other data, while “Relation with other” suggests interconnectedness with other data sets.

Third, “Tangle” illustrates that data is not merely a simple number but is complexly intertwined with various elements. To clearly define data, these intricate interconnections and interdependencies must be accounted for.

In essence, the image presents a definition of data that encompasses accuracy, resolution, relationships with external conditions, and intricate interconnectedness. It emphasizes that to truly grasp the nature of data, one must comprehensively consider all these aspects.

The image underscores that data cannot be reduced to just numeric values; rather, it is a multifaceted concept intricately tied to precision, granularity, external factors, and interdependent relationships. Fully understanding data requires a holistic examination of all these interlinked elements.

Updated by GPT-4o