with a Claude’s help
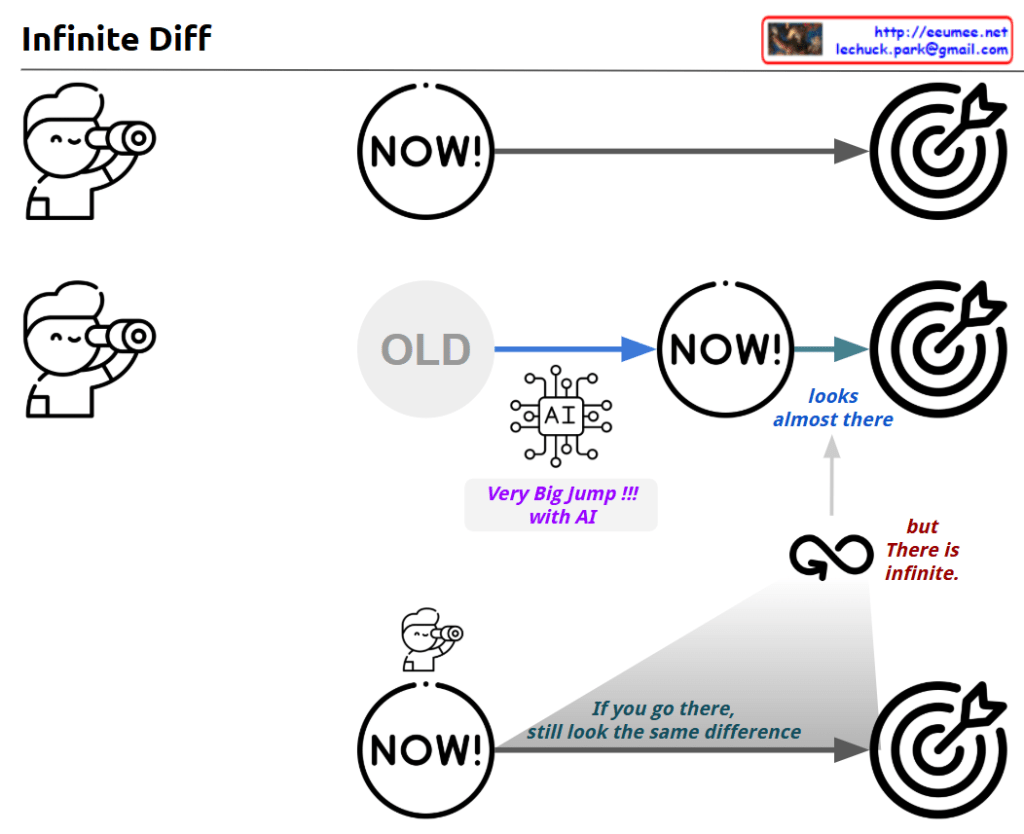
This image, titled “Infinite Diff,” illustrates three scenarios about reaching goals with and without AI:
- The first scenario shows a simple direct path: a straight line from “NOW!” to the target (bullseye).
- The second scenario demonstrates the intervention of AI:
- Starting from “OLD” through AI to reach “NOW!”
- Makes a “Very Big Jump!!!” with AI assistance, getting “looks almost there” to the target
- However, there’s an infinity symbol (∞) with the note “but There is infinite”
- The final scenario shows a distance to the target with the message “If you go there, still look the same difference,” suggesting that regardless of progress, there remains a constant gap to perfection.
The diagram conveys a philosophical message about progress and perfection: while AI can help make significant leaps forward, there will always be infinite room for improvement. Even as we get closer to our goals, there’s always space to grow and improve further.
This visual metaphor effectively communicates the concept that while AI can accelerate progress dramatically, achieving absolute perfection remains an infinite journey – there’s always room for further improvement, no matter how far we’ve come.