NEW Power

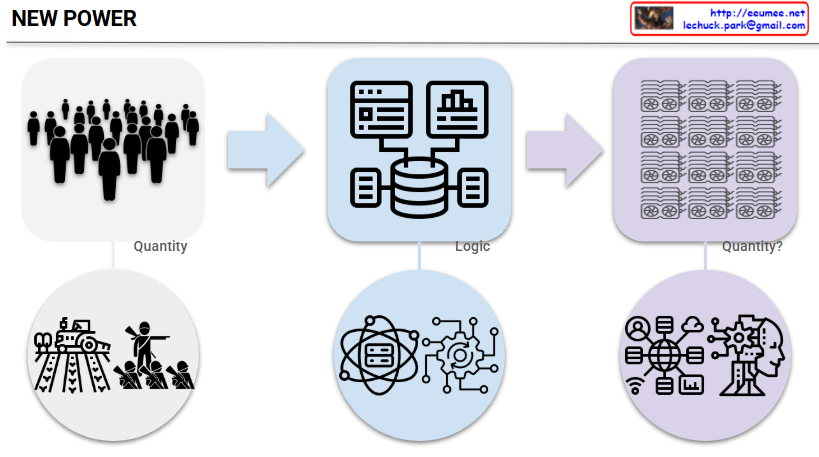
This image titled “NEW POWER” illustrates the paradigm shift in power structures in modern society.

Left Side (Past Power Structure):

  • Top: Silhouettes of people representing traditional hierarchical organizational structures
  • Bottom: Factories, smokestacks, and workers symbolizing the industrial age
  • Characteristic: “Quantity” (volume/scale) centered power

Center (Transition Process):

  • Top: Icons representing databases and digital interfaces
  • Bottom: Technical elements symbolizing networks and connectivity
  • Characteristic: “Logic” based systems

Right Side (New Power Structure):

  • Top: Grid-like array representing massive GPU clusters – the core computing resources of the AI era
  • Bottom: Icons symbolizing AI, cloud computing, data analytics, and other modern technologies
  • Characteristic: “Quantity?” (The return of quantitative competition?) – A new dimension of quantitative competition in the GPU era

This diagram illustrates a fascinating return in power structures. While efficiency, innovation, and network effects – these ‘logical’ elements – were important during the digital transition period, the ‘quantitative competition’ has returned as the core with the full advent of the AI era.

In other words, rather than smart algorithms or creative ideas, how many GPUs one can secure and operate has once again become the decisive competitive advantage. Just as the number of factories and machines determined national power during the Industrial Revolution, the message suggests that we’ve entered a new era of ‘quantitative warfare’ where GPU capacity determines dominance in the AI age.

With Claude

The Evolution of “Difference”

This image is a conceptual diagram showing how the domain of “Difference” is continuously expanded.

Two Drivers of Difference Expansion

Top Flow: Natural Emergence of Difference

  • ExistenceMultiplicityInfluenceChange
  • The process by which new differences are continuously generated naturally in the universe and natural world.

Bottom Flow: Human Tools for Recognizing Difference

  • Letters & DigitsComputation & MemoryComputing MachineArtificial Intelligence (LLM)
  • The evolution of tools that humans have developed to interpret, analyze, and process differences.

Center: Continuous Expansion Process of Difference Domain

The interaction between these two drivers creates a process that continuously expands the domain of difference, shown in the center:

Emergence of Difference

  • The stage where naturally occurring new differences become concretely manifest
  • Previously non-existent differences are continuously generated

↓ (Continuous Expansion)

Recognition of Difference

  • The stage where emerged differences are accepted as meaningful through human interpretation and analytical tools
  • Newly recognized differences are incorporated into the realm of distinguishable domains

Final Result: Expansion of Differentiation & Distinction

Differentiation & Distinction

  • Microscopically: More sophisticated digital and numerical distinctions
  • Macroscopically: Creation of new conceptual and social domains of distinction

Core Message

The natural emergence of difference and the development of human recognition tools create mutual feedback that continuously expands the domain of difference.

As the handwritten note on the left indicates (“AI expands the boundary of perceivable difference”), particularly in the AI era, the speed and scope of this expansion has dramatically increased. This represents a cyclical expansion process where new differences emerging from nature are recognized through increasingly sophisticated tools, and these recognized differences in turn enable new natural changes.

With Claude

Temperate Prediction in DC (II) – The start and The Target

This image illustrates the purpose and outcomes of temperature prediction approaches in data centers, showing how each method serves different operational needs.

Purpose and Results Framework

CFD Approach – Validation and Design Purpose

Input:

  • Setup Data: Physical infrastructure definitions (100% RULES-based)
  • Pre-defined spatial, material, and boundary conditions

Process: Physics-based simulation through computational fluid dynamics

Results:

  • What-if (One Case) Simulation: Theoretical scenario testing
  • Checking a Limitation: Validates whether proposed configurations are “OK or not”
  • Used for design validation and capacity planning

ML Approach – Operational Monitoring Purpose

Input:

  • Relation (Extended) Data: Real-time operational data starting from workload metrics
  • Continuous data streams: Power, CPU, Temperature, LPM/RPM

Process: Data-driven pattern learning and prediction

Results:

  • Operating Data: Real-time operational insights
  • Anomaly Detection: Identifies unusual patterns or potential issues
  • Used for real-time monitoring and predictive maintenance

Key Distinction in Purpose

CFD: “Can we do this?” – Validates design feasibility and limits before implementation

  • Answers hypothetical scenarios
  • Provides go/no-go decisions for infrastructure changes
  • Design-time tool

ML: “What’s happening now?” – Monitors current operations and predicts immediate future

  • Provides real-time operational intelligence
  • Enables proactive issue detection
  • Runtime operational tool

The diagram shows these are complementary approaches: CFD for design validation and ML for operational excellence, each serving distinct phases of data center lifecycle management.

With Claude