Standardization for DCIM

From Claude with some prompting
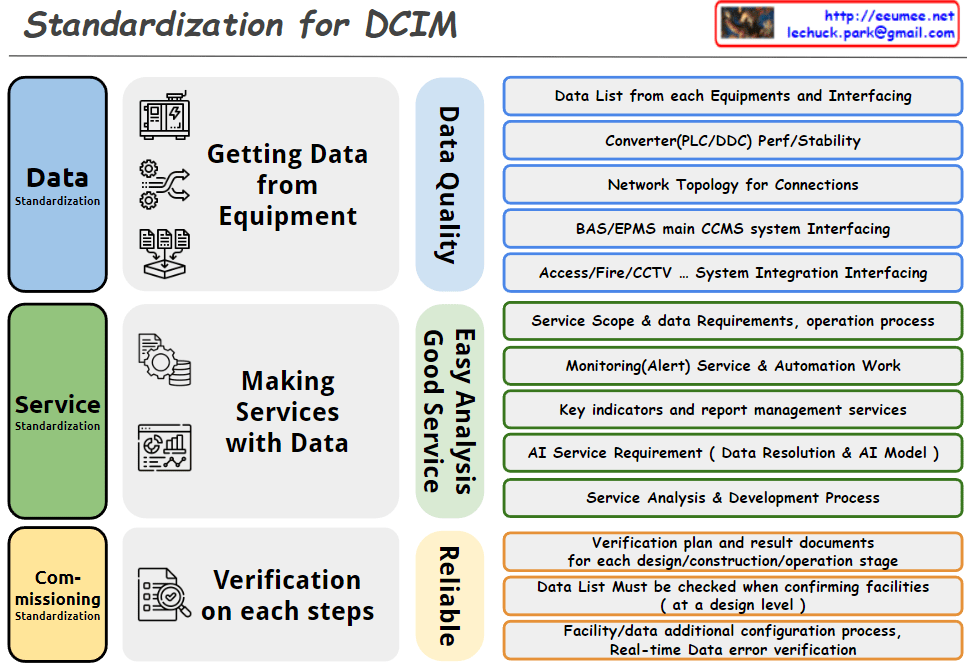
Data Standardization:

  • Defined a clear process for systematically collecting data from equipment.
  • Proposed an integrated data management approach, including network topology and interfacing between various systems.
  • Emphasized data quality management as a key factor to establish a reliable data foundation.

Service Standardization:

  • Structured the process of connecting data to actual services.
  • Highlighted practical service implementation, including monitoring services and automation tasks.
  • Specified AI service requirements, showing a forward-looking approach.
  • Established a foundation for continuous service improvement by including service analysis and development processes.

Commissioning Standardization:

  • Emphasized verification plans and documentation of results at each stage of design, construction, and operation to enable quality management throughout the entire lifecycle.
  • Prepared an immediate response system for potential operational issues by including real-time data error verification.
  • Considered system scalability and flexibility by incorporating processes for adding facilities and data configurations.

Overall Evaluation:

This DCIM standardization approach comprehensively addresses the core elements of data center infrastructure management. The structured process, from data collection to service delivery and continuous verification, is particularly noteworthy. By emphasizing fundamental data quality management and system stability while considering advanced technologies like AI, the approach is both practical and future-oriented. This comprehensive framework will be a valuable guideline for the implementation and operation of DCIM.

Data Life

From ChatGPT with some prompting
reflecting the roles of human research and AI/machine learning in the data process:

Diagram Explanation :

  1. World:
    • Data is collected from the real world. This could be information from the web, sensor data, or other sources.
  2. Raw Data:
    • The collected data is in its raw, unprocessed form. It is prepared for analysis and processing.
  3. Analysis:
    • The data is analyzed to extract important information and patterns. During this process, rules are created.
  4. Rules Creation:
    • This step is driven by human research.
    • The human research process aims for logical and 100% accurate rules.
    • These rules are critical for processing and analyzing data with complete accuracy. For example, creating clear criteria for classifying or making decisions based on the data.
  5. New Data Generation:
    • New data is generated during the analysis process, which can be used for further analysis or to update existing rules.
  6. Machine Learning:
    • In this phase, AI models (rules) are trained using the data.
    • AI/machine learning goes beyond human-defined rules by utilizing vast amounts of data through computing power to achieve over 99% accuracy in predictions.
    • This process relies heavily on computational resources and energy, using probabilistic models to derive results from the data.
    • For instance, AI can identify whether an image contains a cat or a dog with over 99% accuracy based on the data it has learned from.

Overall Flow Summary :

  • Human research establishes logical rules that are 100% accurate, and these rules are essential for precise data processing and analysis.
  • AI/machine learning complements these rules by leveraging massive amounts of data and computing power to find high-probability results. This is done through probabilistic models that continuously improve and refine predictions over time.
  • Together, these two approaches enhance the effectiveness and accuracy of data processing and prediction.

This diagram effectively illustrates how human logical research and AI-driven data learning work together in the data processing lifecycle.

Time Series Data

From Claude with some prompting
This image outlines the process of generating time series data:

  1. Signal Generation: A device produces the raw signal.
  2. Sampling: Converts continuous signal into discrete points.
  3. Digitization: Transforms sampled signal into binary code.
  4. Time Information Addition: Combines digital data with time information.
  5. Labeling/Tagging: Attaches additional descriptive information (e.g., point name, generating equipment, location) to each data point.

The final output is time series data in the format (Point label info, Value, Time), including descriptive information, measured value, and time for each data point. This process creates a comprehensive time series dataset that goes beyond simple numerical data, incorporating rich contextual information for each point.

HTTP Changes

From Claude with some prompting
HTTP: HTTP uses text-based HTML with a head and body structure. HTTP/1.1 introduced Keep-Alive for maintaining TCP connections, but suffers from header overhead and Head-of-Line Blocking issues. Servers cannot push data without a client request.

HTTP/2: HTTP/2 introduced binary framing to improve performance. It enhances efficiency through header compression and multiplexing, and added server push functionality. It also strengthened authentication and encryption using TLS/SSL.

HTTP/3: HTTP/3 operates over the QUIC protocol using UDP instead of TCP. It includes TLS 1.3 by default and provides lower latency and improved multiplexing. HTTP/3 significantly enhances performance through 0-RTT connection establishment, elimination of TCP handshakes, and solving Head-of-Line Blocking issues. It also offers reliable data streams over UDP and ensures data ordering on each stream.

RISC-V

From Claude with some prompting
This image summarizes the key features of the RISC-V architecture:

  1. Open Source: Described as “Everybody Can Use.”
  2. Modularity: Supports “Light Embedded ~ High Computing” applications.
  3. Scalability: Supports “32-bit, 64-bit, and 128-bit address spaces.”
  4. Extension Modules: Includes “floating-point operations, vector operations ++”
  5. Widespread Adoption: “Wide Use chip design, hardware accelerators ++”

The bottom of the image states: “More Better For Specific ML works (Not all replacement of GPU)”

Overall, this image highlights RISC-V’s flexibility, scalability, and applicability in various computing environments. It emphasizes RISC-V’s potential in certain machine learning tasks, while noting that it’s not a complete replacement for GPUs in all ML applications. The architecture is presented as adaptable, from lightweight embedded systems to high-performance computing, with wide-ranging adoption in chip design and hardware acceleration.

Real

From Claude with some prompting
This diagram illustrates the process of human understanding of reality, highlighting the potential discrepancy between “Real Existence” and “Human Real”. The flow chart demonstrates:

  1. REAL EXISTENCE: Represents the objective reality, including the universe and all its phenomena.
  2. Energy Movement: Symbolizes the physical processes occurring in reality.
  3. Sensing: The stage where human sensory organs collect information, albeit in a limited capacity.
  4. Observation: Involves “Sampling”, indicating that we only perceive and process a fraction of reality.
  5. Human Knowledge: Represents the subjective understanding formed based on observed information.

This process underscores a crucial philosophical and epistemological issue: the gap between objective reality and human perception of reality. Humans are constrained by their sensory capabilities and observational methods, leading to a potentially incomplete or distorted understanding of the true nature of existence.

The diagram implies that what we consider “real” may differ significantly from absolute reality due to the limitations of human perception and cognition. This concept is fundamental in various fields, including philosophy, science, and epistemology, challenging our assumptions about knowledge and truth.

This perspective emphasizes the inherent limitations of human understanding and suggests that our perception of reality is inevitably filtered and potentially biased by our cognitive processes and sensory limitations.