Understanding and Predicting

From Claude with some prompting
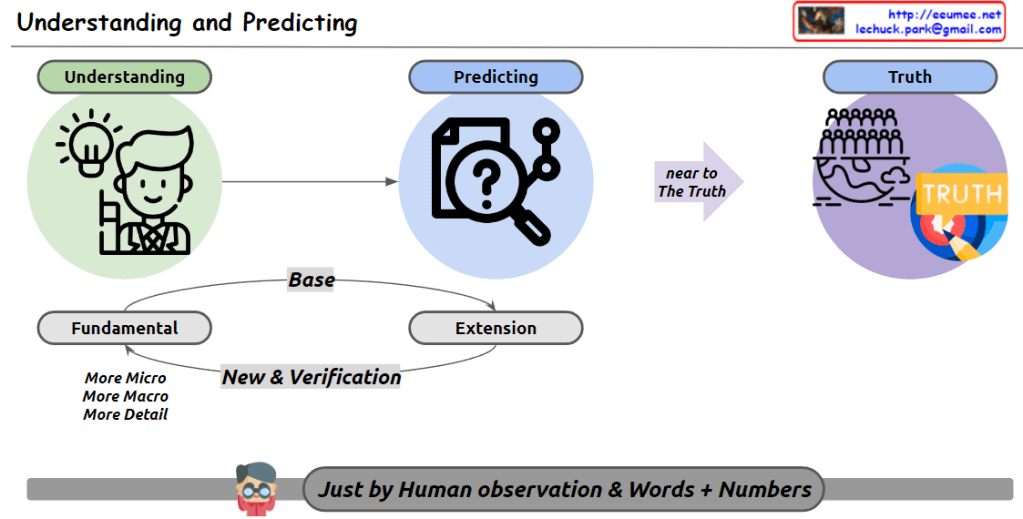
This image illustrates the human process of approaching truth through understanding and prediction. The key components are:

  1. Understanding: Represented by a lightbulb and a human icon, signifying the acquisition of basic knowledge.
  2. Predicting: Symbolized by a magnifying glass with a question mark, indicating the stage where understanding is used to make predictions.
  3. Truth: Depicted by a group of people and a “TRUTH” label, representing the ultimate goal.

These elements are connected sequentially, with prediction aiming to get “near to the Truth.”

The process is built on two foundational concepts:

  • Fundamental
  • Extension

These concepts interact through “New & Verification,” with the fundamental aspect encompassing “More Micro, More Macro, More Detail.”

Key Insights:

  1. Continuous Approach to Truth: Humans are constantly moving towards truth through understanding and prediction. This is a dynamic process, not a static one.
  2. Knowledge Expansion and Refinement: We expand our knowledge by exploring fundamental concepts more microscopically, macroscopically, and in greater detail. This represents growth in both depth and breadth of human knowledge.
  3. Limitations of Human Perception: The phrase “Just by Human observation & Words” at the bottom of the image highlights a fundamental limitation. We can only understand and express the world through our observations and language, not through direct access to matter itself.
  4. Role and Limitations of Numbers: While mathematical expressions can help overcome some linguistic limitations, they too face boundaries when confronting the infinite complexity of the microscopic and macroscopic worlds.
  5. Infinite Nature of Knowledge: As we learn more, we discover there is even more to learn. This paradox suggests an endless journey of discovery and understanding.
  6. Dynamic Process: The pursuit of knowledge is ongoing and ever-evolving, constantly expanding and becoming more refined.

In conclusion, this image portrays the continuous human quest for knowledge and truth, acknowledging our perceptual and expressive limitations while emphasizing our persistent efforts to expand and deepen our understanding of the world around us.

Lechuck History

From Claude with some prompting
“Lechuck History” diagram demonstrates the following technical career progression:

  1. “with Computer” section:
    • Advanced from C-based programming to system programming, O&M solutions, and network programming
    • Possess deep understanding of Linux kernel, RTOS, and TCP/IP stack
    • Performed “Single-Handedly A to Z” tasks in web service analysis/monitoring
    • Grew into the role of a software engineer
  2. “with People” section:
    • Gained experience in large ISP data centers, system management, large-scale network operations management, and CDN development/management
    • Developed skills to optimize and maximize existing system infrastructure
    • Created new service solutions including D/C business web portals, NMS big-data, DCIM, packet analysis customer solutions, and data analysis platforms
    • Managed “Big DC Op. System Design & DevOps”, demonstrating ability to handle customer-facing roles and collaborate with various partners

Additional key competencies:

  1. Maintain continuous interest in new technologies
  2. Possess the ability to quickly learn based on a solid understanding of fundamentals
  3. Currently enjoy learning cutting-edge technologies including AI and Quantum computing

This career path and skill set demonstrate the profile of a professional who continuously grows and pursues innovation in a rapidly changing technological environment.

BAS + EPMS + @ = DCIM

From Claude with some prompting
This image illustrates the distinction between BAS (Building Automation System), EPMS (Energy Power Management System), and DCIM (Data Center Infrastructure Management), explaining their development and relationships.

  1. BAS (Building Automation System):
    • Focuses on general buildings
    • Emphasizes water management and HVAC (cooling) systems
    • Named “BAS” because water and air conditioning were crucial elements in building management
    • Primarily deals with low-power usage environments
    • Includes water control, cooling control, flow control, and pipe/plumbing management
  2. EPMS (Energy Power Management System):
    • Specialized for high-power usage environments
    • Concentrates on power generation, distribution, and control
    • Developed separately from BAS due to the unique complexities of high-power environments
  3. DCIM (Data Center Infrastructure Management):
    • Tailored for data center environments
    • Integrates functions of both BAS and EPMS
    • Manages power (EPMS) and cooling/environmental (BAS) aspects
    • Addresses additional requirements specific to data centers

The diagram clearly shows the background and characteristics of each system’s development:

  • BAS evolved from the need to manage water and air conditioning in general buildings
  • EPMS developed separately due to the specific requirements of high-power environments
  • DCIM integrates and expands on BAS and EPMS functionalities to meet the complex needs of data centers

The formula “BAS + EPMS + @ = DCIM” indicates that DCIM incorporates the functions of BAS and EPMS, while also including additional management capabilities (@) specific to data centers.

This structure effectively demonstrates how each system has specialized and evolved to suit particular environments and requirements, and how they are ultimately integrated in DCIM for comprehensive management of data center infrastructures.

Memoy Leak

From Claude with some prompting
This image illustrates the process of “Memory Leak Checking”. The main components and steps are as follows:

  1. Process Is Started:
    • When a process starts, it connects through an API to a “Like Virtual Machine” environment.
    • In this environment, “Hooking” techniques are employed.
  2. Process Is Running:
    • The running process generates a “Software Interrupt” through the API.
    • There’s “Tracking syscall with Ptrace()” occurring at this stage.
  3. Memory :
    • Functions related to memory allocation, modification, and deallocation (such as malloc(), calloc(), free()) are called.
  4. Memory Leakage Management:
    • This component tracks memory Changes and Status.
  5. OS kernel:
    • OS kernel parameters about memory are involved in the process.

The diagram shows the overall process of detecting and managing memory leaks. It demonstrates how memory leaks are systematically monitored and managed from the start of a process, through its execution, memory management, and interaction with the operating system.
This diagram effectively visualizes the complex process of memory leak checking, showing how different components interact to monitor and manage memory usage in a running process.

HTTP/3 with QUIC & TLS1.3

From Claude with some prompting
This image provides an overview of HTTP/3, highlighting its key features and components:

  1. 0-RTT with TLS1.3 (Zero Round Trip Time):
    • Compares TLS 1.2 and 1.3 connection processes.
    • TLS 1.3 offers faster handshake, reducing latency.
  2. Multiplexing with no HOLB (Head-of-Line Blocking):
    • UDP-based, eliminating TCP’s 3-way handshake and TCP SEQ.
    • Uses frame exchange, structured as streams, messages, and frames.
  3. Reliable:
    • QUIC-based, ensuring reliable data transfer.
    • Uses Connection ID to maintain connections despite client IP or port changes.
    • Packet Number uniquely identifies each packet within a connection.
  4. Flow/Congestion Control:
    • Lists various frame types for traffic optimization.

The diagram emphasizes that HTTP/3 is UDP-based and utilizes the QUIC protocol to enhance connection reliability and efficiency. It illustrates core concepts such as frame-based data exchange and the use of Connection IDs.

The image also details the QUIC header structure, explains how packet ordering and loss handling work, and provides a comprehensive list of frame types used in HTTP/3.

Overall, this diagram effectively visualizes the improvements HTTP/3 brings over its predecessors in terms of speed, reliability, and efficiency in data transfer.