With Claude
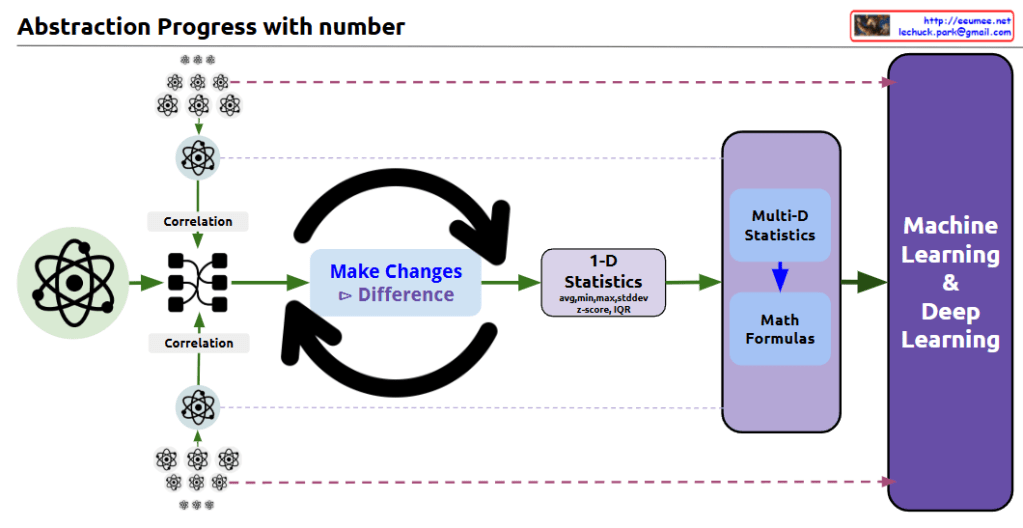
this diagram shows the progression of data abstraction leading to machine learning:
- The process begins with atomic/molecular scientific symbols, representing raw data points.
- The first step shows ‘Correlation’ analysis, where relationships between multiple data points are mapped and connected.
- In the center, there’s a circular arrow system labeled ‘Make Changes’ and ‘Difference’, indicating the process of analyzing changes and differences in the data.
- This leads to ‘1-D Statistics’, where basic statistical measures are calculated, including:
- Average
- Median
- Standard deviation
- Z-score
- IQR (Interquartile Range)
- The next stage incorporates ‘Multi-D Statistics’ and ‘Math Formulas’, representing more complex statistical analysis.
- Finally, everything culminates in ‘Machine Learning & Deep Learning’.
The diagram effectively illustrates the data science abstraction process, showing how it progresses from basic data points through increasingly complex analyses to ultimately reach machine learning and deep learning applications.
The small atomic symbols at the top and bottom of the diagram visually represent how multiple data points are processed and analyzed through this system. This shows the scalability of the process from individual data points to comprehensive machine learning systems.
The overall flow demonstrates how raw data is transformed through various statistical and mathematical processes to become useful input for advanced machine learning algorithms. CopyRet
