From Claude with some prompting
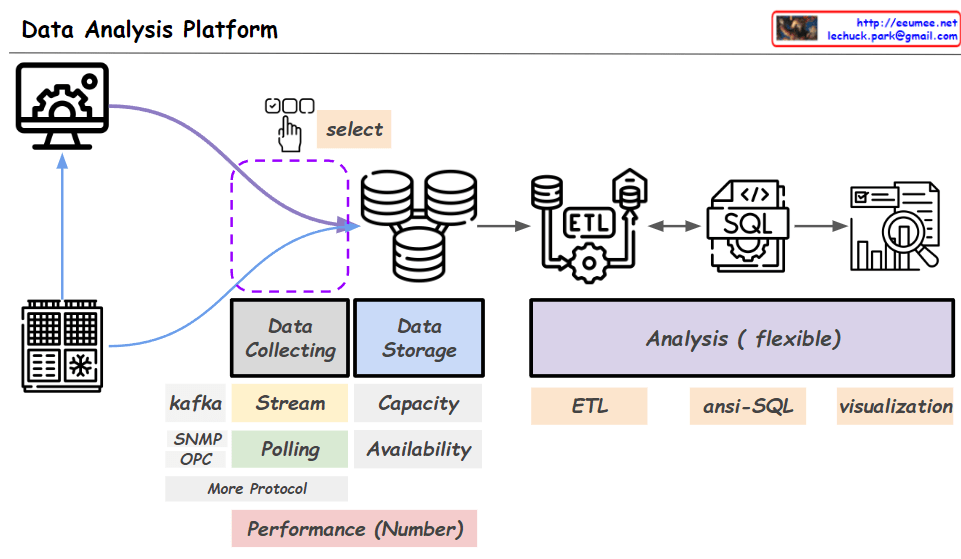
The given image illustrates the overall architecture of a data analysis platform. At the data collecting stage, data is gathered from actual equipment or systems (servers). Protocols like Kafka, SNMP, and OPC are used for data streaming or polling.
The ‘select’ part indicates selecting specific data from the entire collected dataset. Based on the configuration information of the actual equipment, only the data of interest can be selectively collected, allowing the expansion of the data collection scope.
The selected data is stored in a data storage system and then loaded into an SQL database through an ETL (Extract, Transform, Load) process. Afterward, flexible data analysis is enabled using tools like ETL, ansi-SQL, and visualization.
Performance metrics for the entire process are provided numerically, and analysis tasks can be performed through the user interface of the data analysis platform.
The key aspects highlighted are the collection of data from actual equipment/systems, selective data collection based on equipment configuration, data storage, ETL process, SQL database, analysis tools (ETL, SQL, visualization), performance metrics, and the analysis platform user interface.
