Reliability & Efficiency

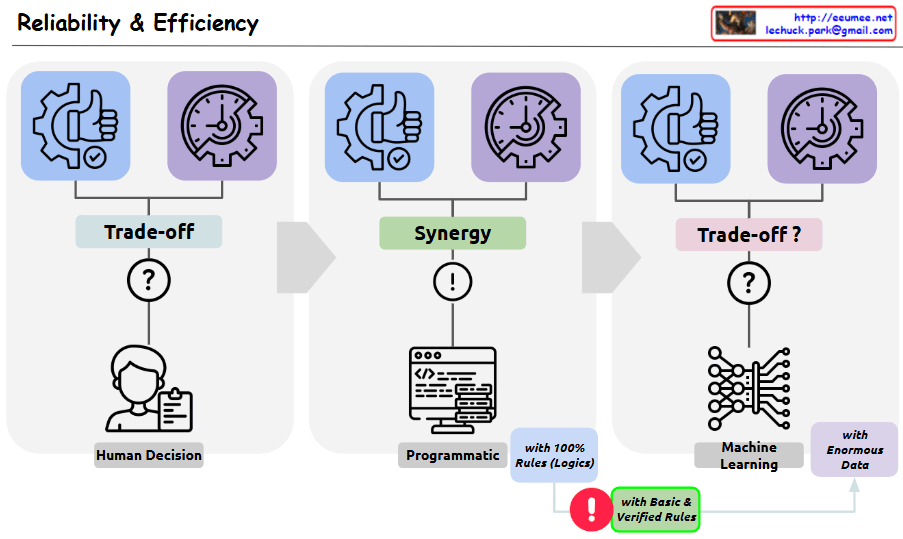
This image is a diagram showing the relationship between Reliability and Efficiency. Three different decision-making approaches are compared:

  1. First section – “Trade-off”:
    • Shows Human Decision making
    • Indicates there is a trade-off relationship between reliability and efficiency
    • Displays a question mark (?) symbol representing uncertainty
  2. Second section – “Synergy”:
    • Shows a Programmatic approach
    • Labeled as using “100% Rules (Logic)”
    • Indicates there is synergy between reliability and efficiency
    • Features an exclamation mark (!) symbol representing certainty
  3. Third section – “Trade-off?”:
    • Shows a Machine Learning approach
    • Labeled as using “Enormous Data”
    • Questions whether the relationship between reliability and efficiency is again a trade-off
    • Displays a question mark (?) symbol representing uncertainty

Importantly, the “Basic & Verified Rules” section at the bottom presents a solution to overcome the indeterminacy (probabilistic nature and resulting trade-offs) of machine learning. It emphasizes that the rules forming the foundation of machine learning systems should be simple and clearly verifiable. By applying these basic and verified rules, the uncertainty stemming from the probabilistic nature of machine learning can be reduced, suggesting an improved balance between reliability and efficiency.

with Claude

Stability + Efficiency = Optimization

From Claude with some prompting
This image illustrates the concept of optimization, which is achieved through a balance between stability and efficiency.

  1. Stability:
    • Represented by the 24-hour clock icon, this refers to the consistency and reliability of a system over time.
  2. Efficiency:
    • Depicted by the gear/dollar sign icon, this represents the ability to maximize output or performance with minimal resources.
  3. Trade-off:
    • The central element shows the conflicting relationship between stability and efficiency.
    • Humans struggle to achieve both stability and efficiency simultaneously.
  4. Programmatic Automation:
    • The system icon suggests that automation or programmatic control can enable a “win-win” scenario, where both stability and efficiency can be optimized.
    • Systems have the capability to overcome the “trade-off” tendency that humans often exhibit.
  5. Optimization:
    • Represented by the gear and chart icon, this is the final, optimized state achieved through the balance of stability and efficiency.
    • By combining the human “trade-off” tendency and the system’s “win-win” capability, a more integrated optimization can be attained.

In summary, this image contrasts the differences between human and system approaches in the pursuit of optimization. By leveraging the strengths of both, the optimal balance between stability and efficiency can be achieved.