AI Prediction

From Claude with some prompting
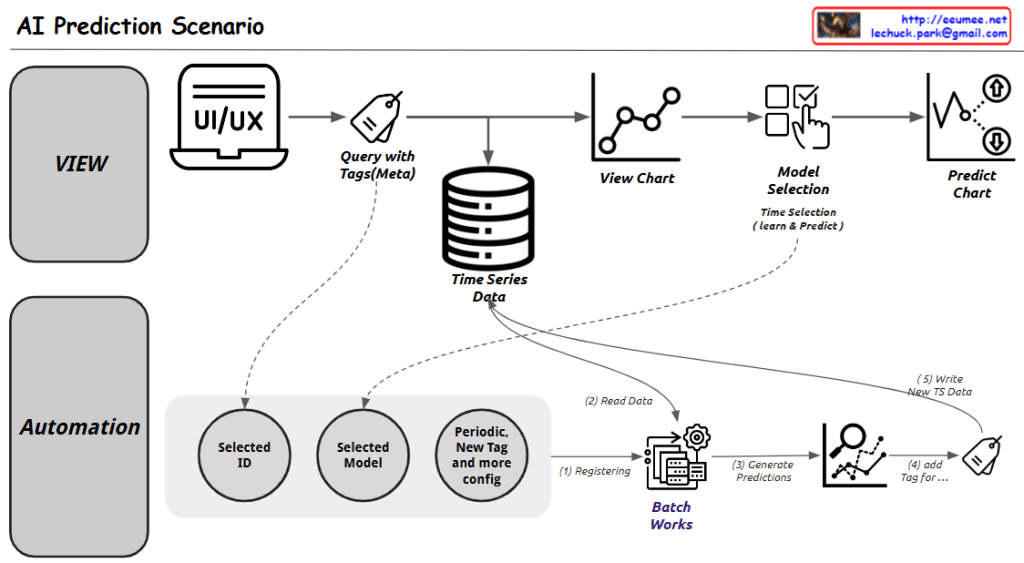
This diagram illustrates an AI Prediction System workflow, which is divided into two main sections:

  1. Upper Section (VIEW):
  • Starts with a UI/UX interface
  • Executes queries with tags (metadata)
  • Connects to time series data storage
  • Displays data visualization charts
  • Includes model selection step
  • Finally generates prediction charts
  1. Lower Section (Automation):
  • Selected ID
  • Selected Model
  • Periodic, new tags and additional configuration
  • Batch work processing (consisting of 4 steps):
    1. Registering
    2. Read Data
    3. Generate Predictions
    4. Add Tag
  • Writing new time series data

The system provides two main functionalities:

  1. A user interface for direct data viewing and prediction execution
  2. Automated batch processing for periodic predictions and data updates

Key Components:

  • Time Series Data storage as a central database
  • View Chart for data visualization
  • Model Selection with time selection (learn & predict)
  • Predict Chart as the final output
  • Batch Works system for automated processing

The workflow demonstrates a comprehensive approach to handling both manual and automated AI predictions, combining user interaction with systematic data processing and analysis. The system appears designed to handle time series data efficiently while providing both immediate and scheduled prediction capabilities.

Time Series Data ETL

From Claude with some prompting
This image illustrates the “Time Series Data ETL” (Extract, Transform, Load) process.

Key components of the image:

  1. Time Series Data structure:
    • Identification (ID): Data identifier
    • Value (Metric): Measured value
    • Time: Timestamp
    • Tags: Additional metadata
  2. ETL Process:
    • Multiple source data points go through the Extract, Transform, Load process to create new transformed data.
  3. Data Transformation:
    • New ID: Generation of a new identifier
    • avg, max, min…: Statistical calculations on values (average, maximum, minimum, etc.)
    • Time Range (Sec, Min): Time range adjustment (in seconds, minutes)
    • all tags: Combination of all tag information

This process demonstrates how raw time series data is collected, transformed as needed, and prepared into a format suitable for analysis or storage. This is a crucial step in large-scale data processing and analysis.

The diagram effectively shows how multiple data points with IDs, values, timestamps, and tags are consolidated and transformed into a new data structure with aggregated information and adjusted time ranges.

Time Series Data

From Claude with some prompting
This image outlines the process of generating time series data:

  1. Signal Generation: A device produces the raw signal.
  2. Sampling: Converts continuous signal into discrete points.
  3. Digitization: Transforms sampled signal into binary code.
  4. Time Information Addition: Combines digital data with time information.
  5. Labeling/Tagging: Attaches additional descriptive information (e.g., point name, generating equipment, location) to each data point.

The final output is time series data in the format (Point label info, Value, Time), including descriptive information, measured value, and time for each data point. This process creates a comprehensive time series dataset that goes beyond simple numerical data, incorporating rich contextual information for each point.