Changes

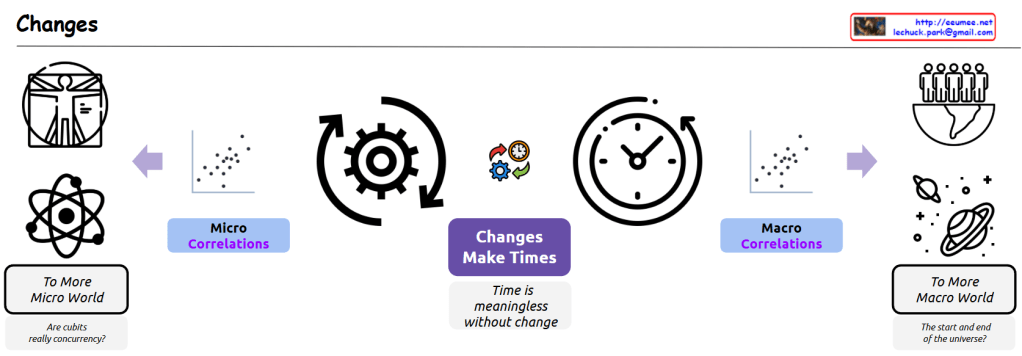
This image is a conceptual diagram titled “Changes” that explores the relationship between time and change. Let me break down its key components:

In the center:

  • There’s a large gear icon and clock symbol with the text “Changes Make Times”
  • Below it states “Time is meaningless without change”

On the left side:

  • Icons showing the Vitruvian Man and an atomic structure
  • Labeled “Micro Correlations”
  • Text reading “To More Micro World”
  • Poses the question “Are qubits really concurrency?”

On the right side:

  • Icons depicting humanity on Earth and celestial objects
  • Labeled “Macro Correlations”
  • Text reading “To More Macro World”
  • Poses the question “The start and end of the universe?”

Throughout the diagram, there are scatter plot graphs and arrows suggesting connections between these different scales.

This diagram appears to be exploring a philosophical and scientific concept about how change and time are interconnected across all scales – from the quantum level (micro) to the cosmic scale (macro). The central thesis seems to be that change is fundamental to our understanding and experience of time, as suggested by the statement that time is meaningless without change.

The diagram suggests a continuous spectrum of investigation from quantum mechanics (represented by qubits) all the way to cosmology (represented by questions about the universe’s beginning and end), with change being the common thread that connects these different scales of existence.

– With Claude

The time

with a claude’s help
This image provides deep insights into the essence of time. The key points can be summarized as follows:

  1. Continuity of change: As shown in the image, everything is in a constant state of change. This phenomenon is observed even at the most fundamental atomic level.
  2. Observation and unitization: Humans observe these changes, identify recurring patterns, and define units of time accordingly. For example, units like year, 4 seasons, and day have been created based on the cycles of the Earth’s rotation and revolution.
  3. Humanization of the time concept: The defined time units have been concretized into forms that humans can easily understand and use. In other words, observing natural phenomena and interpreting them from a human-centric perspective is the essence of the time concept we know.
  4. Relationship between change and measurement: Time is a concept measured based on change. The time units we use routinely in daily life are essentially standardizations of natural cycles of change.

From a scientific perspective, this image explains the concept of time from multiple angles. The ceaseless change at the atomic level is a scientific fact, and the accumulation of these microscopic changes manifests as the macroscopic changes we perceive in nature. Humans have observed and measured these natural patterns of change to construct the concept of time.

However, the time units are not entirely objective. They can vary based on human physiological and cultural factors. Therefore, time can be viewed as a product of human interpretation and utilization of natural phenomena.

In summary, this image effectively illustrates the essence of the time concept from various perspectives. It shows how the changes in nature and human observation and measurement have given rise to the idea of time.

Metric

From Claude with some prompting
the diagram focuses on considerations for a single metric:

  1. Basic Metric Components
  • Point: Measurement point (where it’s collected)
  • Number: Actual measured values (4,5,5,8,4,3,4)
  • Precision: Accuracy of measurement
  1. Time Characteristics
  • Time Series Data: Collected in time series format
  • Real Time Streaming: Real-time streaming method
  • Sampling Rate: How many measurements per second
  • Resolution: Time resolution
  1. Change Detection
  • Changes: Value variations
    • Range: Acceptable range
    • Event: Notable changes
  • Delta: Change from previous value (new-old)
  • Threshold: Threshold settings
  1. Quality Management
  • No Data: Missing data state
  • Delay: Data latency state
  • With All Metrics: Correlation with other metrics
  1. Pattern Analysis
  • Long Time Pattern: Long-term pattern existence
  • Machine Learning: Pattern-based learning potential

In summary, this diagram comprehensively shows key considerations for a single metric:

  • Collection method (how to gather)
  • Time characteristics (how frequently to collect)
  • Change detection (what changes to note)
  • Quality management (how to ensure data reliability)
  • Utilization approach (how to analyze and use)

These aspects form the fundamental framework for understanding and implementing a single metric in a monitoring system.

Time Series Data

From Claude with some prompting
This image outlines the process of generating time series data:

  1. Signal Generation: A device produces the raw signal.
  2. Sampling: Converts continuous signal into discrete points.
  3. Digitization: Transforms sampled signal into binary code.
  4. Time Information Addition: Combines digital data with time information.
  5. Labeling/Tagging: Attaches additional descriptive information (e.g., point name, generating equipment, location) to each data point.

The final output is time series data in the format (Point label info, Value, Time), including descriptive information, measured value, and time for each data point. This process creates a comprehensive time series dataset that goes beyond simple numerical data, incorporating rich contextual information for each point.

The Time is

From Claude with some prompting
This image explains the concept of time and its relation to gravity. Here’s a breakdown of the main points:

  1. Definition of Time:
    • It’s described as “The smallest unit of change” → “The smallest unit of time change * N” → “1 Second”.
  2. Gravity’s Influence:
    • The image states “Everything is affected by gravity.”
    • Gravity influences gear changes and signal changes, as shown by the icons.
  3. Relationship between Time and Gravity:
    • Time is affected by gravity.
    • The higher the gravity (lower place), the slower the changes, resulting in slower passage of time.
    • The lower the gravity (higher place), the faster the change, leading to faster passage of time.

This diagram simplifies one of the key concepts of Einstein’s General Theory of Relativity – how gravity affects the passage of time. It illustrates this complex idea in a straightforward, visual manner.

The time ??

From Gemini with some prompting
The image depicts the concept of time and its relationship to matter, light, and change. Here’s a breakdown of the image elements:

  • Clock: Represents the measurement of time.
  • Atoms: Symbolize matter.
  • Sun: Represents light.
  • Rays of Light: Represent change.
  • Text: Includes explanations of time units, quantum, light, change, and the interconnectedness of everything.

Image Analysis

The image conveys that time is intricately intertwined with matter, light, and change. Time is used to measure the movement of matter and light, while change signifies the passage of time.

Text Analysis

  • “Time” clearly indicates the image’s subject matter.
  • “Standard” refers to the widely used system of time units.
  • “Standard???” suggests the existence of alternative time unit systems.
  • “Invisible” and “Can be seen” highlight the relativity of time. Time is not absolute but can be perceived differently depending on the observer’s perspective.
  • “Unit of change” emphasizes that time is a unit used to measure change.
  • “Quantum??” raises questions about the concept of time in quantum mechanics. In quantum mechanics, time is sometimes considered not continuous but composed of discrete units.
  • “Light” indicates the connection between light and time. The speed of light is a reference point for time measurement.
  • “Everything affects each other” signifies that time, matter, light, and change are interconnected.

Overall Interpretation

The image is a multifaceted representation of the complexity and diversity of time. It goes beyond time as a mere tool for counting numbers and delves into its profound relationship with matter, light, and change.