Analysis and Interpretation of the Business Transformation Roadmap
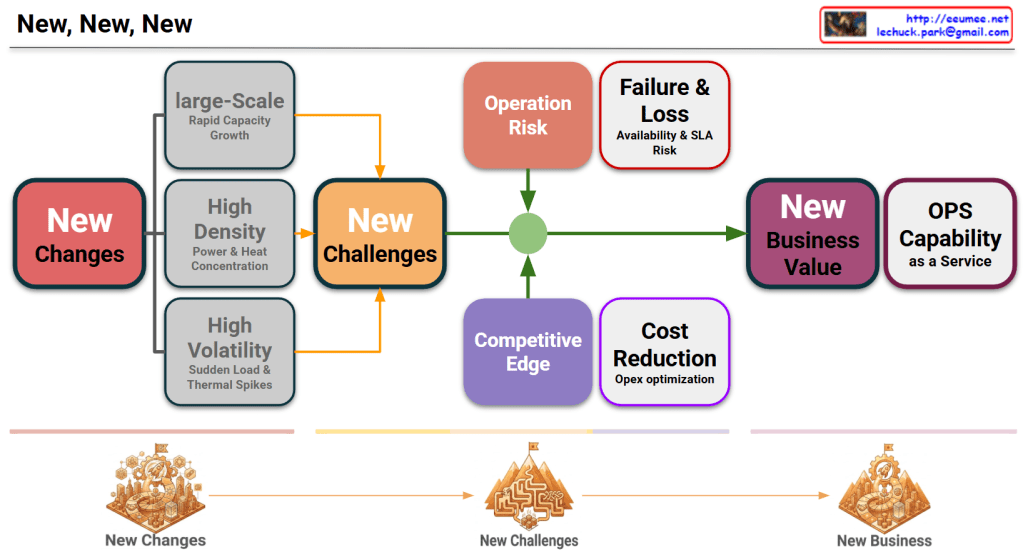
This diagram provides a comprehensive visualization of how modern business is shaped by rapid technological and environmental shifts. It illustrates a cause-and-effect relationship, moving from changes to challenges, and ultimately to new business value.
The diagram is structured with a detailed, text-based flow at the top and a high-level, visual metaphoric flow at the bottom.
Overall Flow Interpretation
The logical progression is a linear transformation:
1. New Changes -> 2. New Challenges -> 3. New Business Value / New Business
This structure suggests that rapid environmental changes (1) give rise to new risks and challenges (2), which, when successfully overcome, create new business value and models (3).
Detailed Interpretation of the Upper Flow
- New Changes:
- Initiation: The starting point (red box) triggers the entire process.
- Specificity: It is detailed into three grey boxes that define the nature of modern changes:
- large-Scale: Defined as “Rapid Capacity Growth” (e.g., cloud computing, massive data increases).
- High Density: Defined as “Power & Heat Concentration” (e.g., increased server density in data centers).
- High Volatility: Defined as “Sudden Load & Thermal Spikes” (e.g., unpredictable traffic bursts, unstable operating environments).
- New Challenges:
- The specific changes converge at the ‘New Challenges’ (amber box), indicating that these factors combined create a new set of challenges.
- Outcomes (Risks and Opportunities):
- New challenges produce results in two directions (risk-oriented vs. opportunity-oriented):
- Risk-Oriented Outcomes: (Red/Orange boxes)
- Operation Risk: Operational risks that need to be managed.
- Failure & Loss: Defined as “Availability & SLA (Service Level Agreement) Risk,” highlighting potential negative consequences like service downtime.
- Opportunity-Oriented Outcomes: (Purple/Violet boxes)
- Competitive Edge: The strategic advantage gained by overcoming the challenges.
- Cost Reduction: Defined as “Operating expenditure (Opex) optimization,” pointing towards financial efficiency as an opportunity.
- New Business Value:
- By managing risks, preventing failures, securing a competitive edge, and reducing costs, new business value (purple/magenta box) is generated.
- OPS Capability as a Service:
- The ultimate output is the “OPS Capability as a Service” (white box with text). This signifies that the new business value is realized through a new business model: providing standardized, efficient operational capabilities to external or internal clients as a service.
Detailed Interpretation of the Lower Flow (Visual Metaphors)
The lower section visualizes the same three-stage process using sophisticated isometric icons.
- New Changes (City Icon):
- A complex, intricate city landscape with a handshake, a data cube, and a rocket. This symbolizes the complex and innovative nature of ‘New Changes’, visualizing the text-based changes from above.
- New Challenges (Mountain Icon):
- A sophisticated mountain maze with many pathways. This symbolizes the difficult and exploratory nature of ‘New Challenges’, directly visualizing the central amber box from above.
- New Business (Refined City Icon):
- A city landscape similar to the first, but much more refined and organized. The city looks cleaner and more complete. The rocket is poised for launch. This symbolizes the sophisticated and realized ‘New Business’, visualizing the final “New Business Value” and “Capability as a Service.”
In summary, this diagram is a roadmap showing how a complex interplay of large-scale, high-density, and high-volatility changes creates new operational challenges, but by managing these risks and seizing the opportunities, a company can create new business value and a new “Operations Capability as a Service” business model.
#BusinessTransformation #TechShifts #OperationsManagement #BusinessValue #OperationRisk #SLA #CostOptimization #CompetitiveEdge #CapabilityAsAService #BusinessDiagram #ProcessFlow #ScaleUp #DataCenter #NewBusiness #InnovationRoadmap
With Gemini
