Time Series Data

From Claude with some prompting

  1. Raw Time Series Data:
    • Data Source: Sensors or meters operating 24/7, 365 days a year
    • Components: a. Point: The data point being measured b. Metric: The measurement value for each point c. Time: When the data was recorded
    • Format: (Point, Value, Time)
    • Additional Information: a. Config Data: Device name, location, and other setup information b. Tag Info: Additional metadata or classification information for the data
    • Characteristics:
      • Continuously updated based on status changes
      • Automatically changes over time
  2. Processed Time Series Data (2nd logical Data):
    • Processing Steps: a. ETL (Extract, Transform, Load) operations b. Analysis of correlations between data points (Point A and Point B) c. Data processing through f(x) function
      • Creating formulas through correlations using experience and AI learning
    • Result:
      • Generation of new data points
      • Includes original point, related metric, and time information
    • Characteristics:
      • Provides more meaningful and correlated information than raw data
      • Reflects relationships and influences between data points
      • Usable for more complex analysis and predictions

Through this process, Raw Time Series Data is transformed into more useful and insightful Processed Time Series Data. This aids in understanding data patterns and predicting future trends.

Getting server data

From Claude with some prompting
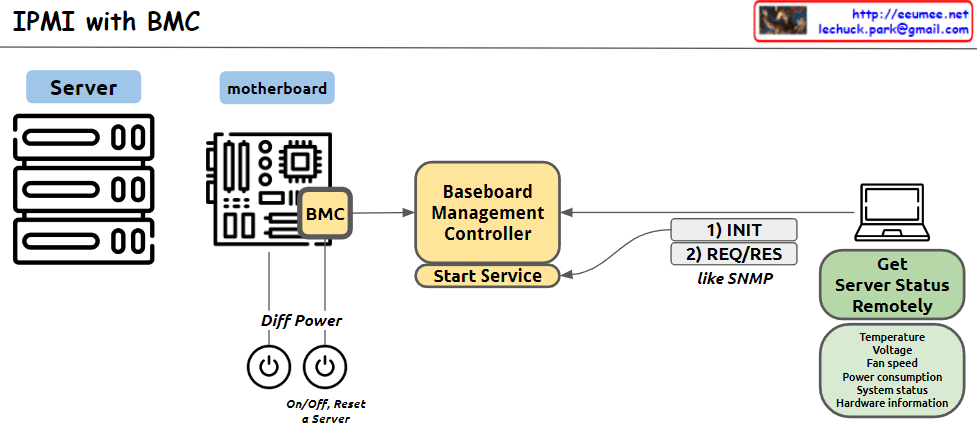
This image illustrates the structure of an IPMI (Intelligent Platform Management Interface) system using BMC (Baseboard Management Controller). The main components and functions are as follows:

  1. Server: Represents the managed server.
  2. Motherboard: Depicts the server’s mainboard, where the BMC chip is located.
  3. BMC (Baseboard Management Controller): The core component for monitoring and managing server hardware.
  4. Baseboard Management Controller: Performs the main functions of the BMC, with a “Start Service” function indicated.
  5. Diff Power: Represents the server’s power management functions, including On/Off and Reset capabilities.
  6. Remote management computer: Used to remotely monitor and manage the server status.
  7. Get Server Status Remotely: Server status information that can be checked remotely, including temperature, voltage, fan speed, power consumption, system status, and hardware information.
  8. Communication process: The interaction between the remote computer and BMC is shown to involve 1) INIT (initialization) and 2) REQ/RES (request/response) stages, described as functioning similar to SNMP.

This system allows administrators to remotely monitor and control the physical state of the server.

By Software System

From Claude with some prompting
This image illustrates the improvement of work processes through a software system. It’s divided into two parts, with the left side showing manual work and the right side depicting work done through a software system.

Left side (Manual):

  1. Work: Represented by a wrench icon
  2. Process: Shown as a flowchart-like icon
  3. Stability and Efficiency are shown in a trade-off relationship with arrows

Right side (Software System):

  1. Automation: Depicted by a rotating gear icon
  2. Optimization: Represented by an ascending graph icon
  3. Long Jump: Shown with a clock and hourglass icon
    • Described as “Get great results over a long period of time”
  4. Both Stability and Efficiency are shown to increase with upward arrows

The image demonstrates that implementing a software system can simultaneously improve stability and efficiency, and through automation and optimization, achieve significant long-term results.

This diagram effectively contrasts the limitations of manual processes with the benefits of implementing a software system for work processes.