Here’s a summary of Uretprobe, a Linux kernel tracing/debugging tool:
- Overview:
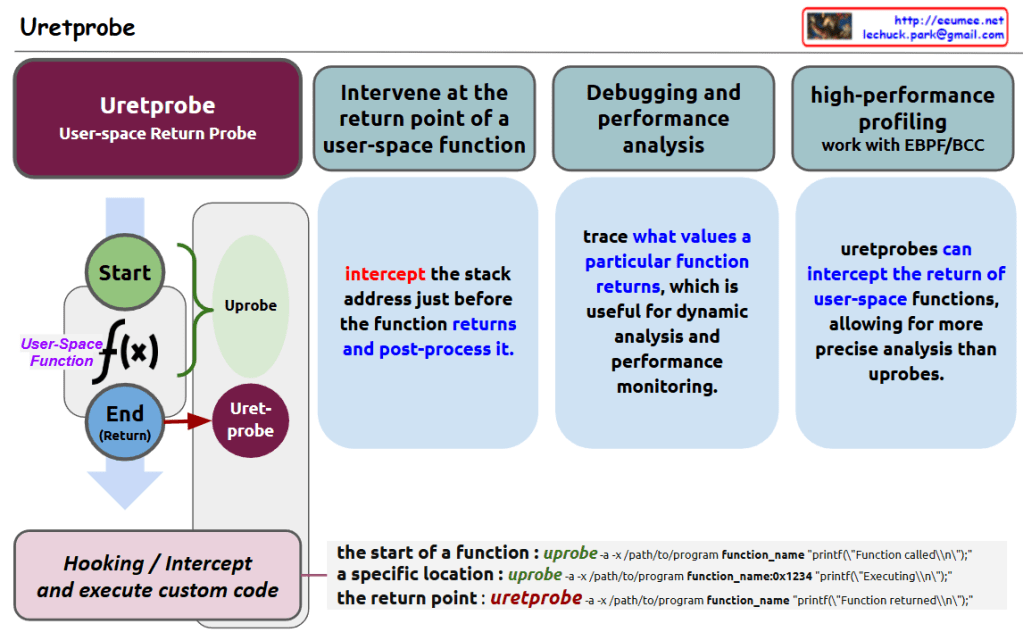
- Uretprobe is a user-space return probe tool designed to monitor function returns in user space
- It can track the execution flow from function start to end/return points
- Key Features:
- Ability to intervene at the return point of user-space functions
- Intercepts the stack address just before function returns and enables post-processing
- Supports debugging and performance analysis capabilities
- Can trace specific function return values for dynamic analysis and performance monitoring
- Advantages:
- Provides more precise analysis compared to uprobes
- Can be integrated with eBPF/BCC for high-performance profiling
The main benefit of Uretprobe lies in its ability to intercept user-space operations and perform additional code analysis, enabling deeper insights into program behavior and performance characteristics.
Similar tracing/debugging mechanisms include:
- Kprobes (Kernel Probes)
- Kretprobes (Kernel Return Probes)
- DTrace
- SystemTap
- Ftrace
- Perf
- LTTng (Linux Trace Toolkit Next Generation)
- BPF (Berkeley Packet Filter) based tools
- Dynamic Probes (DynProbes)
- USDT (User Statically-Defined Tracing)
These tools form part of the Linux observability and performance analysis ecosystem, each offering unique capabilities for system and application monitoring.
