With a Claude’s Help
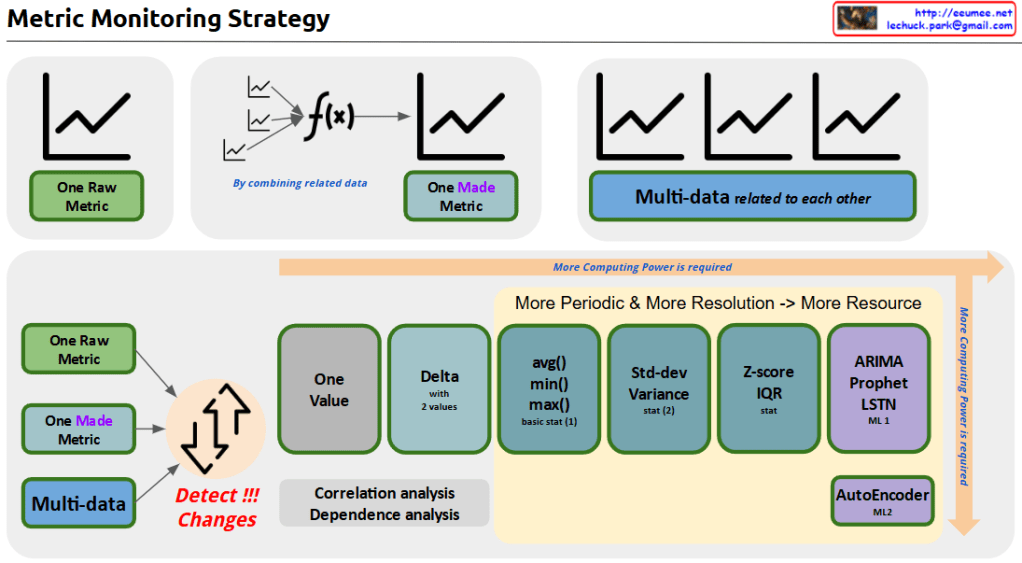
the Metric Monitoring System diagram:
- Data Hierarchy (Top)
- Raw Metric: Unprocessed source data
- Made Metric: Combined metrics from related data
- Multi-data: Interrelated metrics sets
- Analysis Pipeline (Bottom)
Progressive Stages:
- Basic: Change detection, single value, delta analysis
- Intermediate: Basic statistics (avg/min/max), standard deviation
- Advanced: Z-score/IQR
- ML-based: ARIMA/Prophet, LSTM, AutoEncoder
Key Features:
- Computing power increases with complexity (left to right)
- Correlation and dependency analysis integration
- Two-tier ML approach: ML1 (prediction), ML2 (pattern recognition)
Implementation Benefits:
- Resource optimization through staged processing
- Scalable analysis from basic monitoring to predictive analytics
- Comprehensive anomaly detection
- Flexible system adaptable to different monitoring needs
The system provides a complete framework from simple metric tracking to advanced machine learning-based analysis, enabling both reactive and predictive monitoring capabilities.
Additional Values:
- Early warning system potential
- Root cause analysis support
- Predictive maintenance enablement
- Resource allocation optimization
- System health forecasting
This architecture supports both operational monitoring and strategic analysis needs while maintaining resource efficiency through its graduated approach to data processing.Copy