From Claude with some prompting
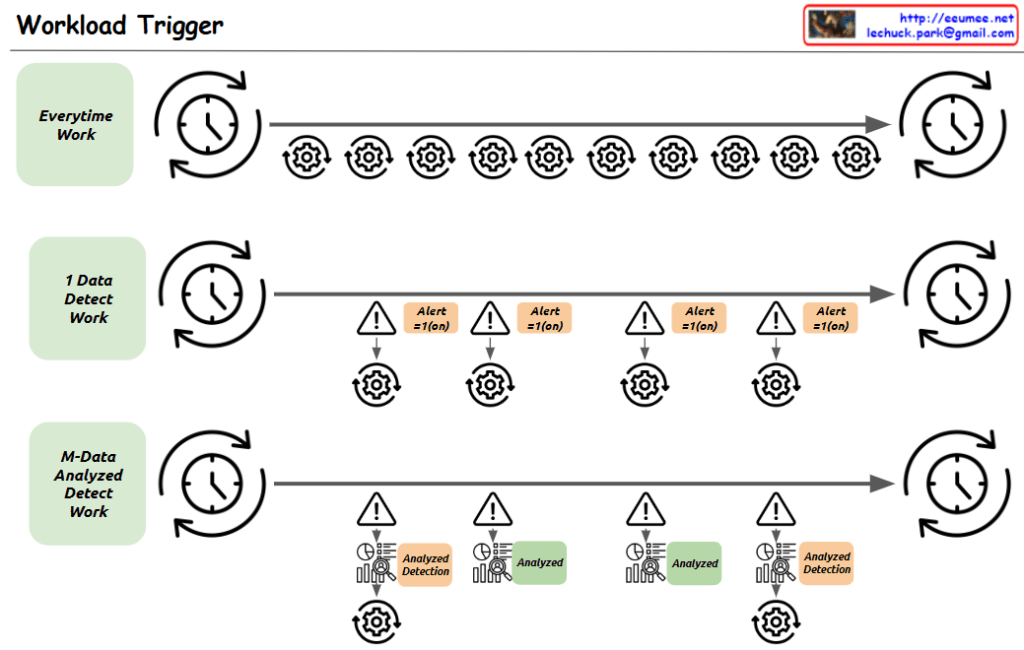
The image appears to be a diagram illustrating a “Workload Trigger” process. It shows three main stages of work:
- “Everytime Work”: This stage indicates work that is performed at a regular interval, represented by the repeating gear symbols.
- “1 Data Detect Work”: This stage shows data detection work that triggers alerts based on certain conditions, represented by the alert symbols.
- “M-Data Analyzed Detect Work”: This stage shows data analysis work that also triggers alerts based on the analysis results, represented by the analyzed detection symbols.
The overall flow of the diagram moves from left to right, with the work cycling through the three main stages. The timing of the work cycles is indicated by the clocks at the start and end of each stage.
The diagram seems to be illustrating some kind of automated monitoring or analysis workflow that triggers alerts based on the detection of certain data patterns or conditions.
