From Claude with some prompting
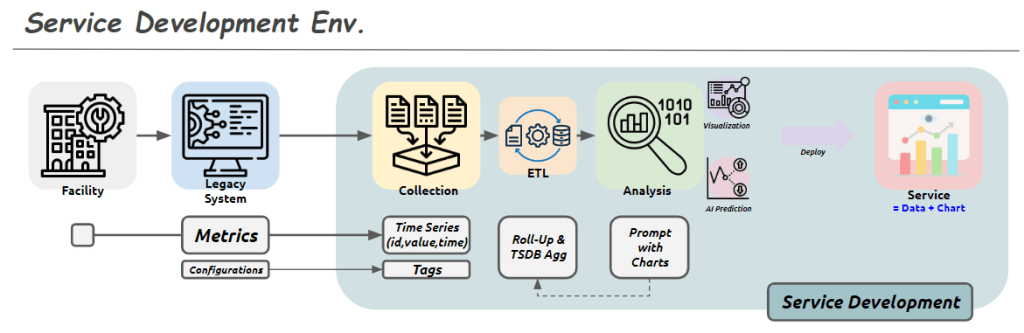
This image shows a diagram titled “Service Development Env.” (Service Development Environment). It illustrates the stages of a service development process:
- Facility: Represented by a building icon, serving as the starting point.
- Legacy System: Depicted by a computer screen icon.
- Collection: Shown as multiple document icons.
- ETL (Extract, Transform, Load): Represented by gear and database icons.
- Analysis: Indicated by a magnifying glass icon, including visualization and AI prediction capabilities.
- Deploy: Represented by a screen icon with charts, described as “Service = Data + Chart”.
The lower part of the diagram shows additional process steps:
- Metrics: Includes Configurations.
- Time Series: Stores data in (id, value, time) format.
- Tags
- Roll-Up & TSDB Agg (Time Series Database Aggregation)
- Prompt with Charts
Overall, this diagram illustrates the entire service development process from data collection to analysis, visualization, and final service deployment. Each stage represents the steps of processing, storing, analyzing data, and ultimately delivering it to end-users.
The flow suggests a progression from legacy systems and facilities, through data collection and processing, to advanced analysis and deployment of data-driven services
