From Claude with some prompting
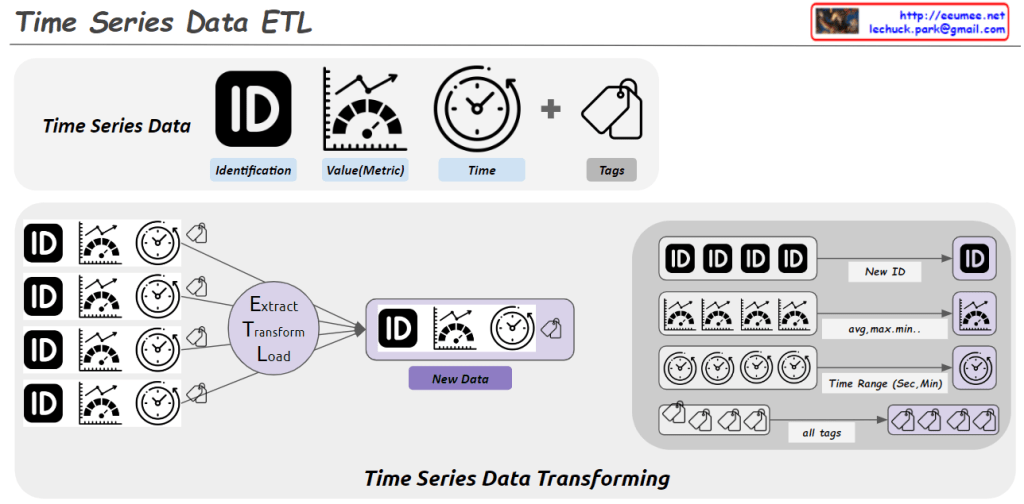
This image illustrates the “Time Series Data ETL” (Extract, Transform, Load) process.
Key components of the image:
- Time Series Data structure:
- Identification (ID): Data identifier
- Value (Metric): Measured value
- Time: Timestamp
- Tags: Additional metadata
- ETL Process:
- Multiple source data points go through the Extract, Transform, Load process to create new transformed data.
- Data Transformation:
- New ID: Generation of a new identifier
- avg, max, min…: Statistical calculations on values (average, maximum, minimum, etc.)
- Time Range (Sec, Min): Time range adjustment (in seconds, minutes)
- all tags: Combination of all tag information
This process demonstrates how raw time series data is collected, transformed as needed, and prepared into a format suitable for analysis or storage. This is a crucial step in large-scale data processing and analysis.
The diagram effectively shows how multiple data points with IDs, values, timestamps, and tags are consolidated and transformed into a new data structure with aggregated information and adjusted time ranges.
