From DALL-E with some prompting
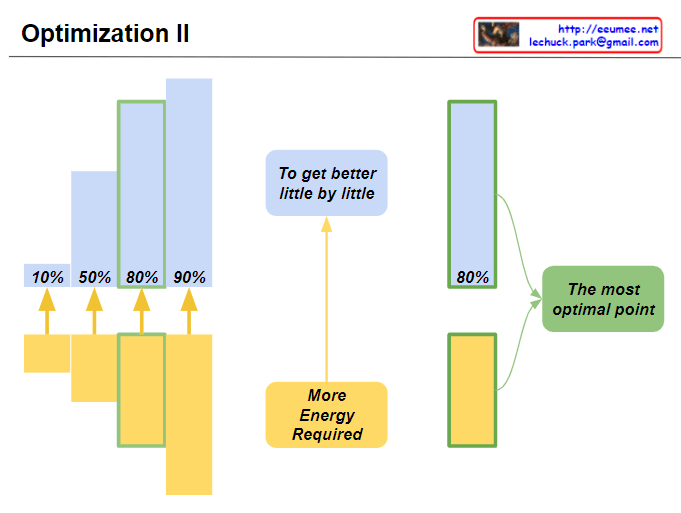
The image represents an optimization process depicted by a bar graph. The left side of the graph displays efficiency levels at 10%, 50%, 80%, and 90%, with increasing energy requirements indicated by golden arrows for each efficiency milestone. It visually communicates that while efficiency can be incrementally improved through optimization, achieving higher levels of efficiency demands progressively more energy.
On the right, a bar indicating 80% efficiency is highlighted as “the most optimal point,” suggesting a balance between efficiency and energy demand. This point reflects the trade-off where further increases in efficiency may not be economically justified due to the additional energy cost. The phrase “To get better little by little” suggests that the ideal point of optimization can be reached through gradual improvement.
