from DALL-E with some prompting
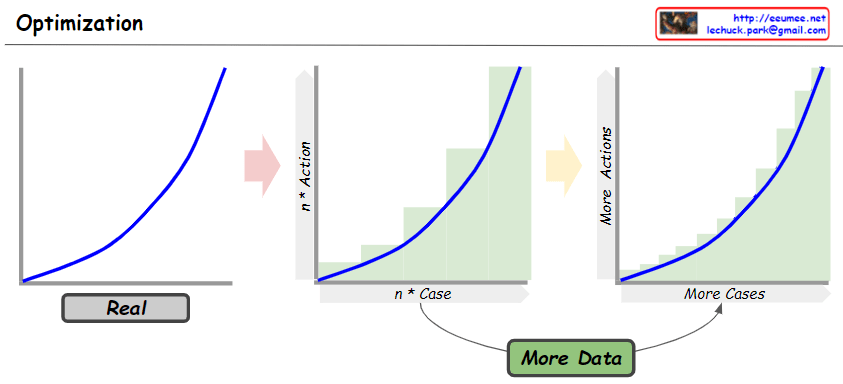
This diagram demonstrates that the optimization process becomes more sophisticated with the increase of data. The first graph represents the actual analog conditions, and as more data is introduced, the bar chart in the middle shows that actions can be more finely differentiated for various cases. The last graph illustrates how this refinement enhances the optimization curve. In essence, optimization can be more precisely adjusted based on a diverse range of data and scenarios.
